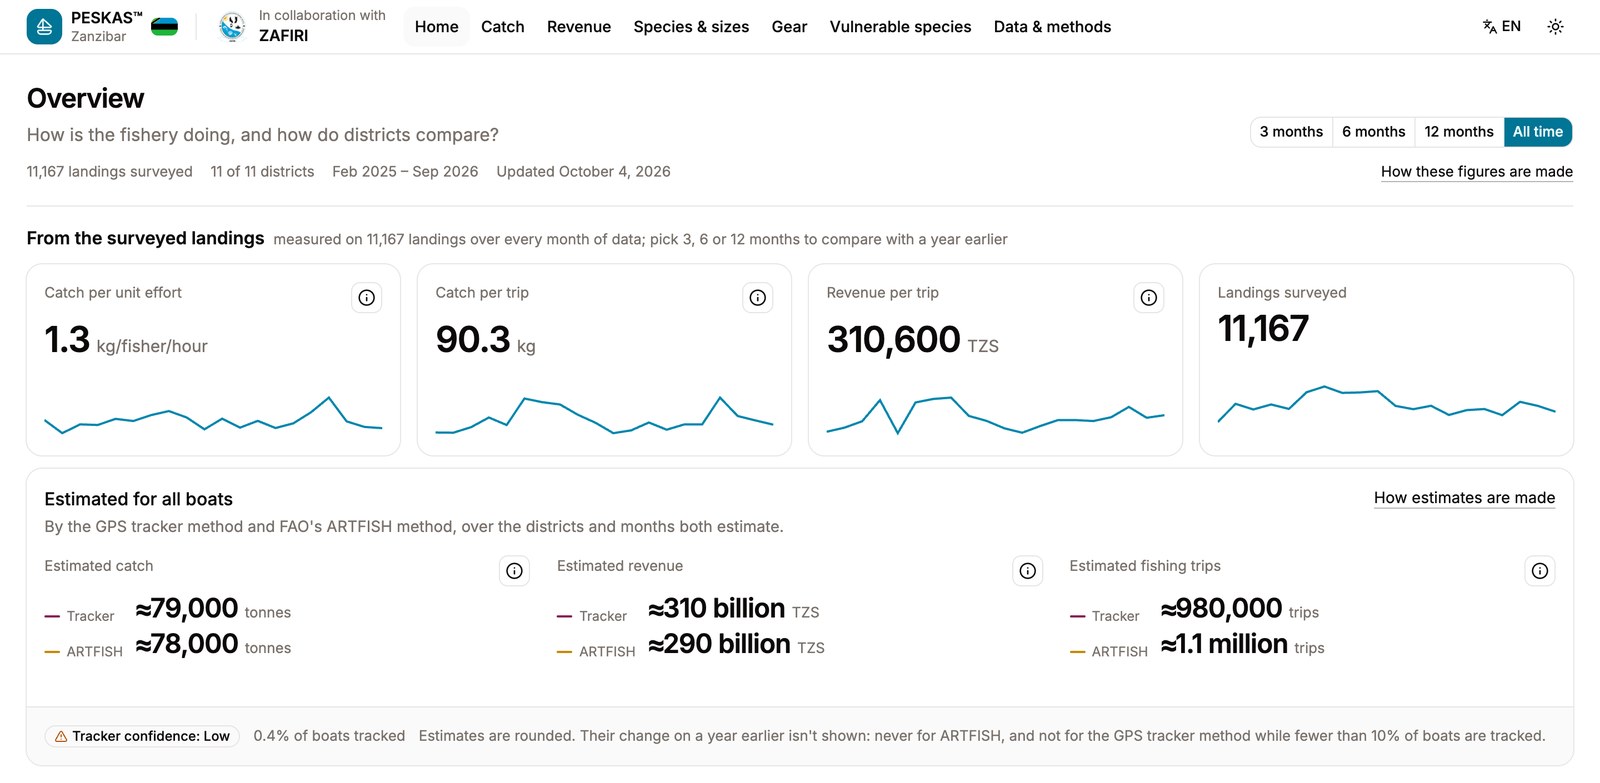
The Peskas country dashboards show what small-scale fishers land in Zanzibar, Kenya and Mozambique: how much is caught, what it is worth, and how that changes from district to district and month to month. Each one is developed with a national partner whose teams collect the landing data: the Zanzibar Fisheries and Marine Resources Research Institute (ZAFIRI), the Kenya Fisheries Service (KEFS) and Mozambique's National Directorate of Fisheries and Aquaculture (DINAPA). They are public; open to anyone without an account, and currently available in English, Swahili, and Portuguese.
Over the past months we have rebuilt them. The first versions described the catch well, but a fisheries department designing policies to protect a fishery or species of concern needs more than catch totals. The new dashboards are organised around those decisions, and they state plainly what each number can and cannot support.
Built around management questions
Each page now opens with the question it answers. How is the fishery doing, and how do districts compare? Which gears are used, what do they catch, and do they land fish before those fish can reproduce? Are species that recover slowly from fishing a large or growing part of the catch? The answers follow, starting with what was recorded at the landing sites and moving on to estimates for the whole fleet.
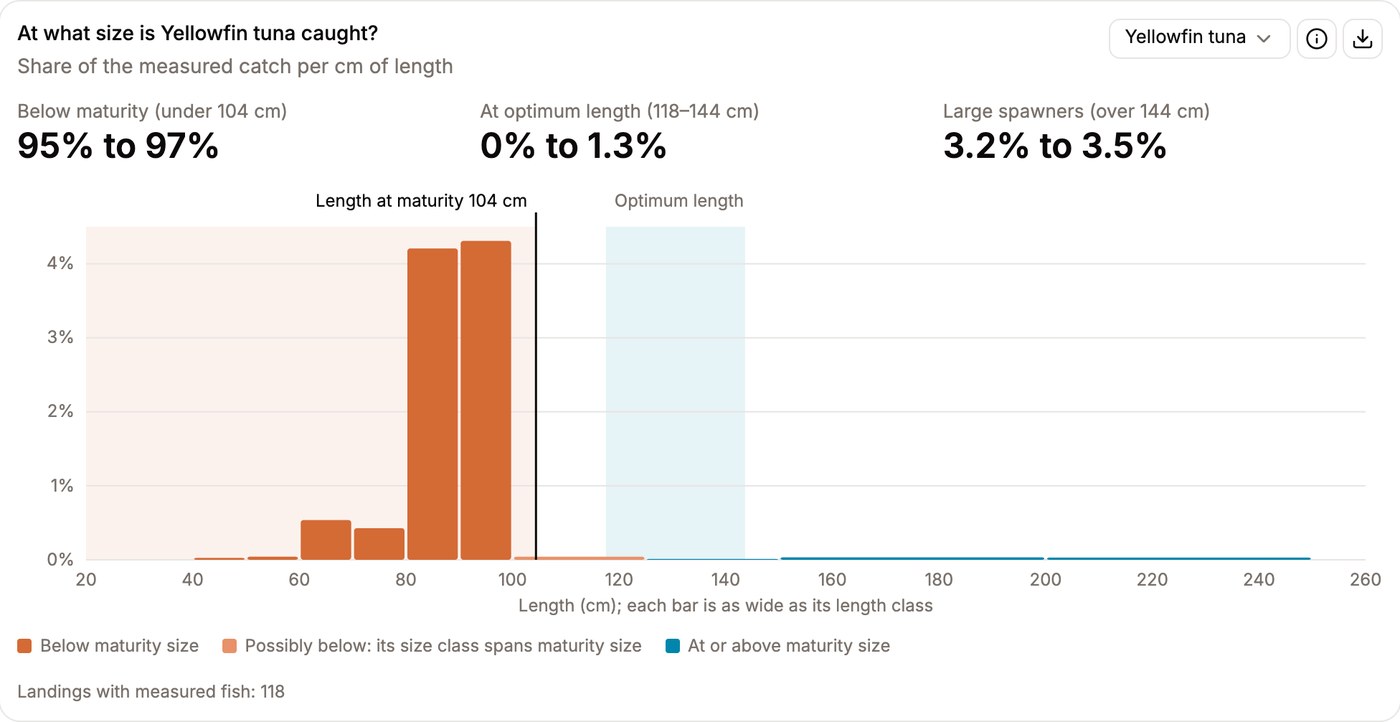
The first new information presented is the fish length and maturity. For each species measured with sufficient catch data, the dashboard compares the length of the fish landed with the length of reproductive maturity (Lm). It shows what proportion of the catch are immature, the % at optimum length, and the % of large spawners: the three simple indicators proposed by Froese in 2004. Enumerators record fish in length classes, so these shares are given as ranges.
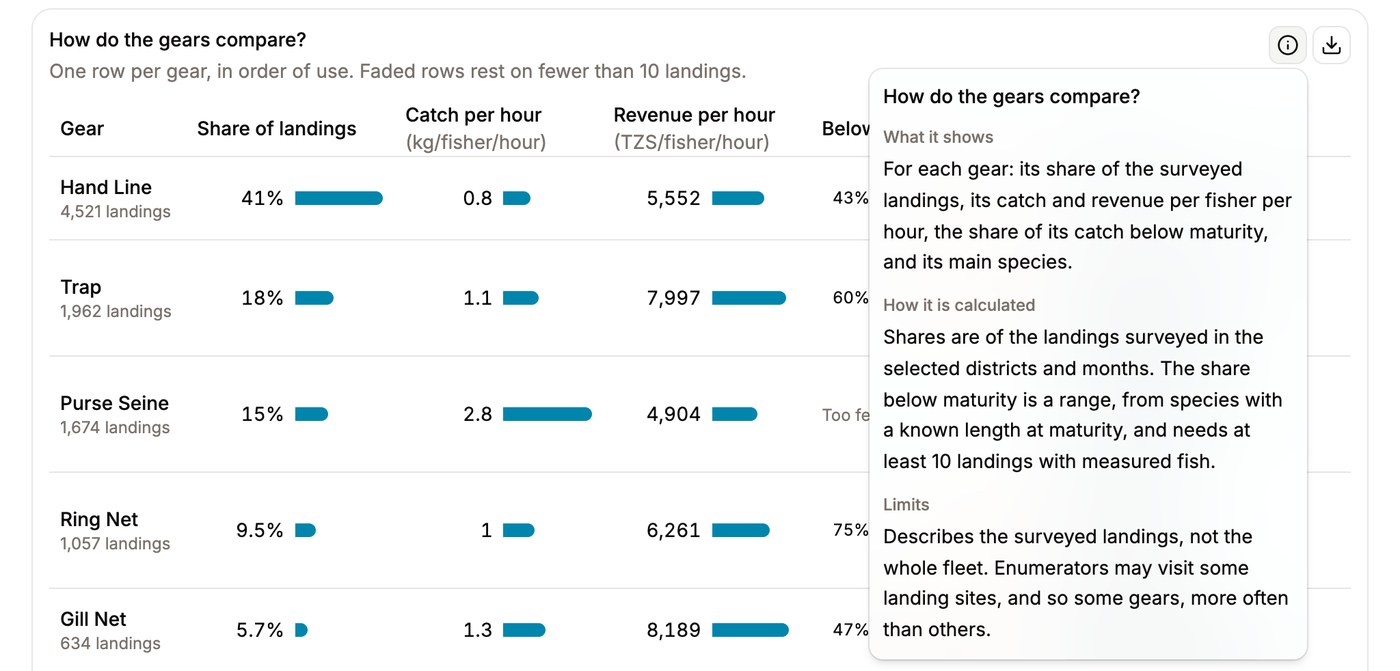
The second new information is fishing gear. A single table compares every gear: its share of the surveyed landings, how much it catches and earns per fisher per hour, how much of its catch is below the size at maturity, and the species it lands the most.
The third new info is vulnerability. A new page shows how much of the catch comes from species that recover slowly from fishing, such as large, long-lived species that mature slowly. It also shows how much of the catch is sharks and rays, the IUCN Red List and CITES status of each species landed, and whether the catch is moving down the food web.
Most of this relies on direct links to FishBase.org and SeaLifeBase.org, the global databases of fish and other aquatic species. The Peskas pipelines match every species group recorded at landing to its species in these databases, among those recorded in the Western and Eastern Indian Ocean, and bring in their vulnerability to fishing, trophic level, IUCN category, CITES listing, and lengths at maturity and at optimum. FishBase already supplies the nutrient figures in Peskas Timor-Leste. Here it gives the landing data the biological context needed to read it for management.
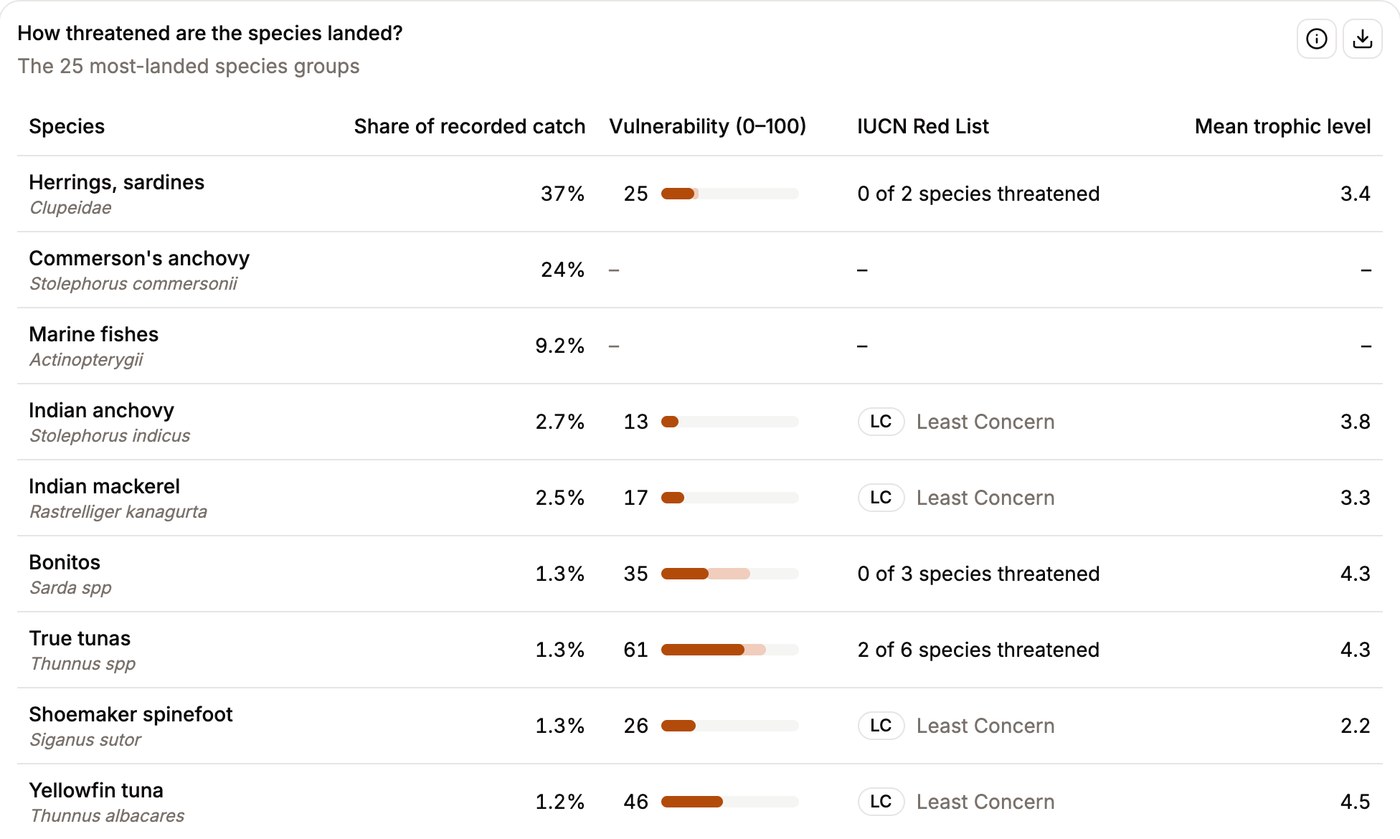
These are early-warning indicators. A falling catch rate, a high proportion of small (immature) fish or a growing share of vulnerable species show where a closer look is needed. None of them measures the stock biomass or trajectory, and the dashboards say so.
Extrapolating total catch estimates using FAO's standard method
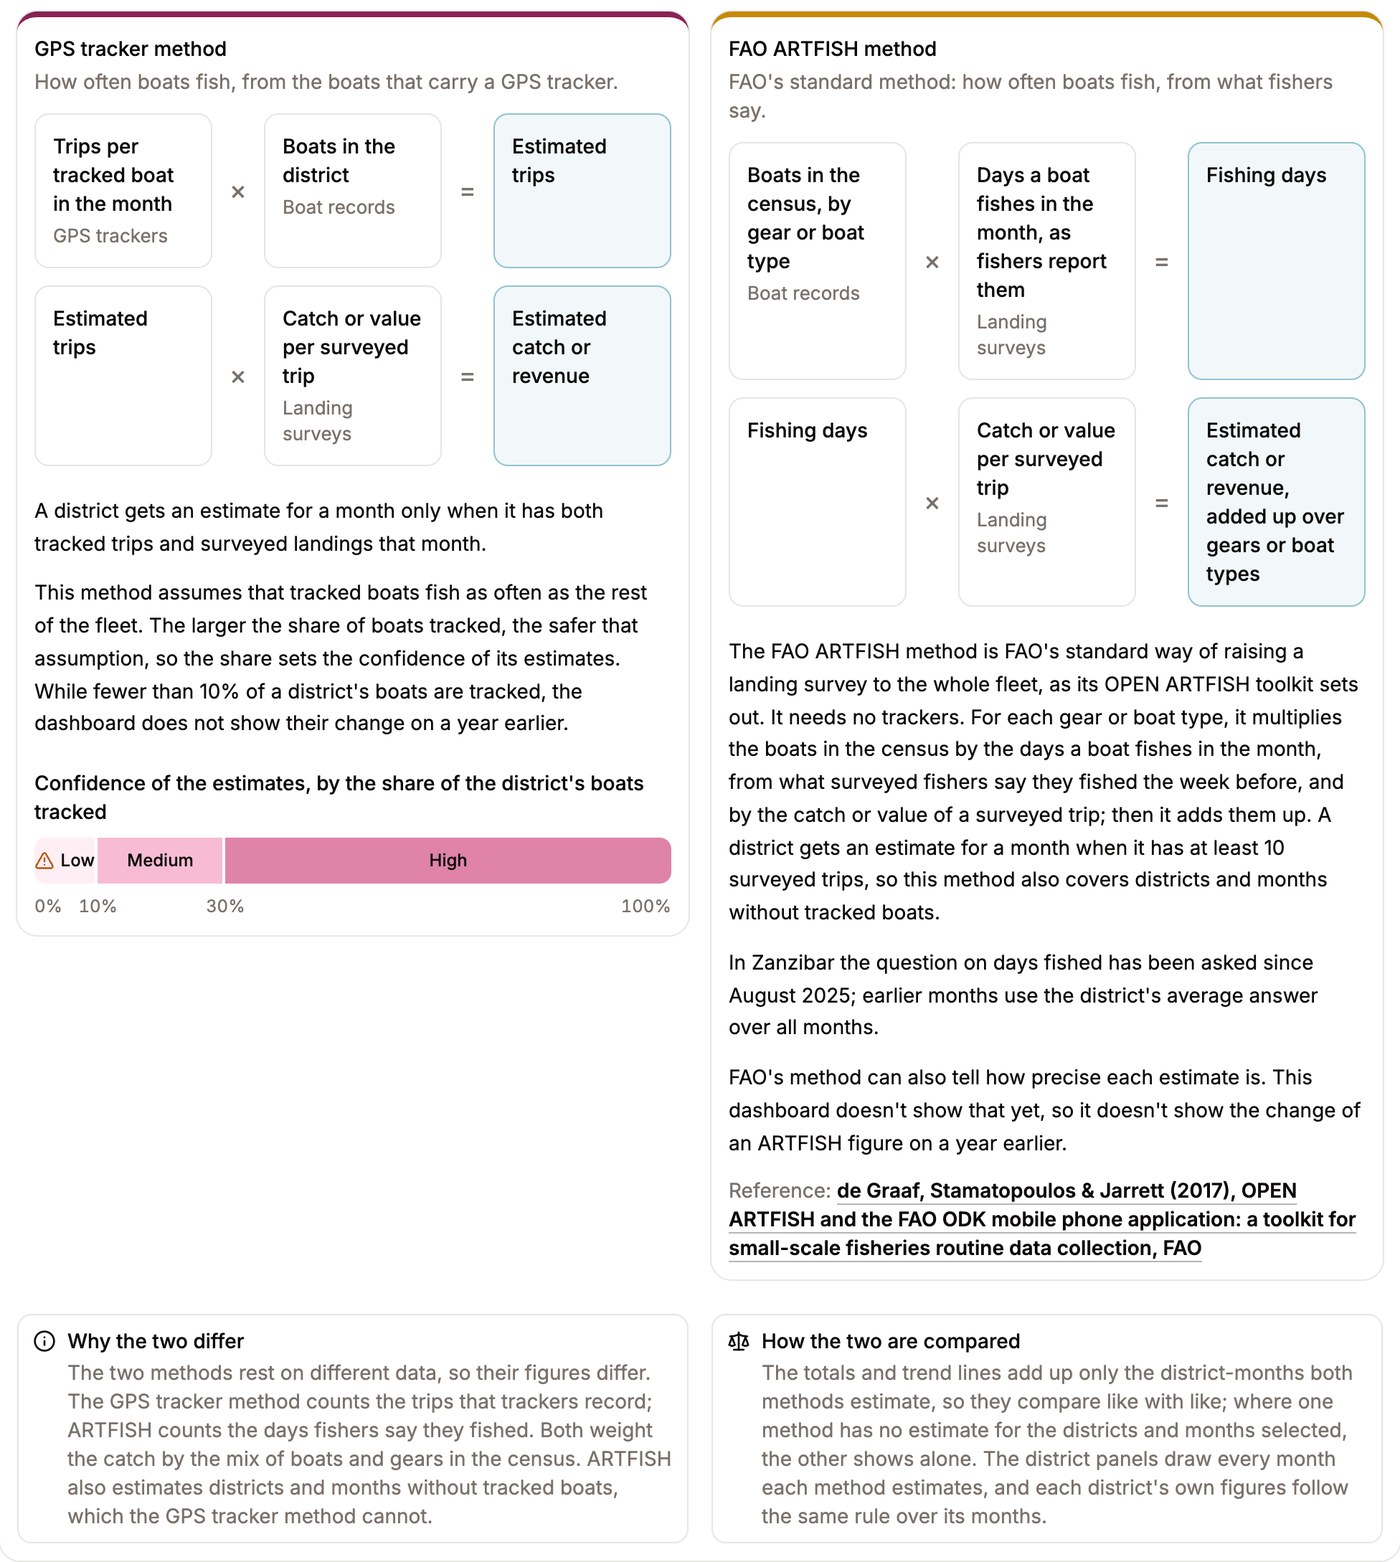
Enumerators record a sample of the total landings. To estimate the total catch of a district, that sample has to be raised to the whole district's fleet. Until now, Peskas did this with the 'vessel activity coefficient' derived from vessel trackers: how often and for how long tracked boats go fishing, multiplied by the number of boats in the district and by the total catch volume of a surveyed trip. The method is only as good as the proportion of boats that are tracked, and in these three countries that proportion is small.
We have now added FAO's standard method for this task, set out in its OPEN ARTFISH toolkit. For each gear or boat type, it multiplies the number of boats in the fleet census by the days a boat fishes in the month (reported by fishers), and by the catch or value of a surveyed trip. It needs no trackers, so it also covers districts and months where no boat is tracked. In Zanzibar, the catch survey has been asking fishers how many days per month they fish since August 2025.
The method runs inside the country data pipelines, with the same code for all three countries, so every monthly summary now carries both estimates (ARTFISH and VMS based). The dashboards show them side by side, each with its own name and colour. Their totals add up only the districts and months that both methods estimate, so the comparison is like with like, and the Data and Methods page explains why they differ: one counts the trips that trackers record, the other the days fishers report that they fished. Using FAO's method puts the estimates on an internationally recognised basis, which matters when they are used in official statistics and reporting.
One data structure, ready for more countries
Every figure on the dashboard starts from the data that the Peskas API serves: validated fishing-trip records, organised in one shared structure no matter which survey they come from. Shared pipeline code turns those records into monthly summaries by district, gear, species and size, adds the FishBase traits and the two catch estimates, and publishes them as a fixed set of tables with documented names and fields. The dashboards read only those tables.
That shared structure makes the dashboards straightforward to extend. Zanzibar, Kenya and Mozambique run on a single codebase. Each country is a set of settings: its districts and regions, currency, languages, map view, and how its survey records the catch. Adding a country means adding those settings and the translations. Once a country's data reaches Peskas in the shared structure, the same summaries, indicators and explanations follow.
%%{init: {'theme': 'neutral', 'themeVariables': { 'fontFamily': 'Roboto Condensed', 'fontSize': '14px'}}}%%
flowchart LR
  S([Landing surveys<br>in each country]) --> V[Cleaning &<br>validation]
  V --> API{{Peskas API<br>validated trips,<br>one shared structure}}
  API --> U([Authorised users<br>& partners])
  API --> SUM[Shared summaries:<br>catch, gear, species,<br>sizes, catch estimates,<br>fishing effort]
  G([GPS trackers]) --> SUM
  FB([FishBase &<br>SeaLifeBase]) --> SUM
  SUM --> D[One dashboard,<br>set up per country]
Where fishing happens
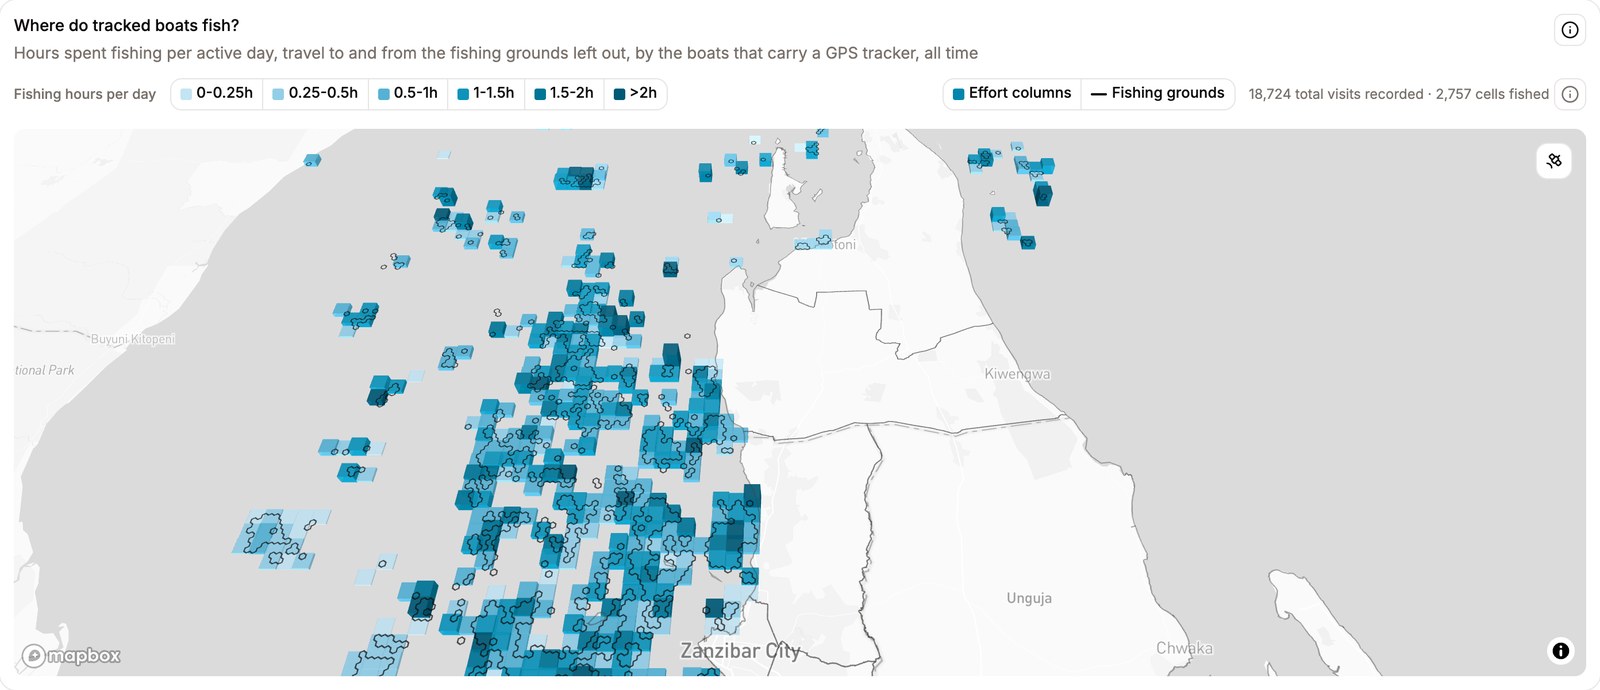
The home page map shows where boats carrying GPS trackers from Pelagic Data Systems spend their time fishing. A model reads each track and keeps only the time spent fishing, leaving out the travel to and from the fishing grounds. The result is drawn on hexagonal cells of about 0.1 km², each fished on at least three trips. Columns show the hours of fishing per active day, and the fishing grounds that boats keep returning to are outlined, with their figures shown on hover. It is the same fishing activity shown for the whole region on Peskas Coasts, here for one country at a time.
Marine spatial planning needs this kind of evidence, because decisions on protected areas, aquaculture or other uses of the sea have to account for the grounds fishers already use. The map notes that it covers only boats carrying a tracker.
Every figure explained
A number on a dashboard is only useful if the reader knows where it comes from and how it is calculated. A new Data and Methods page sets this out in one place. It covers who collects the data and what is recorded for each trip, how records are checked, and how both catch estimates are made, with diagrams. It explains what every metric shows, how it is calculated and the confidence, and how species and sizes are matched to the catch. A glossary gives the terms in plain words, and a table shows how many landings were surveyed in each district and month, so it is clear where the data is thin.
The same care runs through the pages. Every chart title is the question the chart answers. Each chart has an information button that explains it in the same terms, and another to download its data. Every page states how many landings, districts and months its figures rest on, and when the data was last updated. Figures based on fewer than ten landings carry a warning sign, recorded and estimated figures are always labelled as such, and estimates are rounded so they do not suggest more precision than they have. Colours mean the same thing on every page and remain distinct for colour-blind readers. Pages print cleanly, and a link to a page keeps its time range and districts, so a view can be shared exactly as it was seen.
What comes next?
Two key elements come next. The first is stock assessment. When fish lengths are recorded, it is possible to apply length-based assessment methods, which can be used to estimate the biomass of a single species from the frequency and quantity of different sizes of the fish present in the catch. For these methods to be accurate, sufficient measurements of catches by size are required, so it is feasible only for the most commercially important species. We plan to start with pilots for a few species, run together with national research partners, and to show their results beside the indicators they build on.
The second is a way to talk with the data. Many of the people who need these figures have little time to work through charts and filters. We are exploring an AI assistant that answers questions asked in plain language, such as "how the catch of a species has changed in a district over the past year?". It would draw on the same validated summaries and the same definitions the dashboards use, so that its answers can be traced back to their source.
Explore the dashboards
- Peskas Zanzibar, with ZAFIRI
- Peskas Kenya, with KEFS
- Peskas Mozambique, with DINAPA
The dashboards are developed by WorldFish in collaboration with MOBEF and ZAFIRI (Zanzibar), KEFS (Kenya) and DINAPA (Mozambique), whose enumerators and survey teams collect the data behind every figure. Species information comes from FishBase and SeaLifeBase, and vessel tracking from Pelagic Data Systems. The shared pipeline code that produces the summaries and both catch estimates is open in the peskas.coasts repository. Get in touch at peskas.platform@gmail.com if you would like to know more, or to talk about a Peskas dashboard for your fishery.